מובילים למידה במציאות משתנה
אנו פועלים לקדם את החינוך בישראל בעידן הדיגיטלי באמצעות פיתוח סביבות למידה פורצות דרך המשלבות תוכן, מיומנויות וערכים לצד טכנולוגיה מתקדמת.
קידום למידה היברידית
למידה סינכרונית וא-סינכרונית בכל זמן ומכל מקום באמצעות כלים וסביבות דיגיטליים מתקדמים

למידה פרסונלית ו-Adaptive Learning
טכנולוגיות למידה מבוססות נתונים, המאפשרות מענה לשונות בסביבה הלימודית.
הכנה למקצועות העתיד
פלטפורמות ותכנים לפיתוח מיומנויות הנדרשות להתמודדות עם אתגרי המאה ה-21.
חדשנות במקצועות הליבה
יישום גישות פורצות דרך ורב-תחומיות למקסום חוויית הלמידה בספרי הלימוד ובסביבות הדיגיטליות.
למידה משולבת - Blended Learning
למידה במגוון שיטות וסביבות היוצרות מרחב פיזי-דיגיטלי מאפשר ומותאם לכולם.


פדגוגיה
אנו מפתחים כלים ייחודיים ושיטות לימוד מתקדמות למערכת החינוך, בדגש על קידום תהליכי למידה עצמאית ולמידה היברידית.
תוכן
אנו מחויבים ליצירת תכנים איכותיים ומגוונים ללמידה אפקטיבית ולמתן מענה לתוכניות הלימוד מגיל גן ועד תיכון.
טכנולוגיה
אנו שואפים להתחדש ולהציע פתרונות טכנולוגיים ייחודיים, המאפשרים חוויית למידה רלוונטית ופרסונלית בכיתה ובמרחבים שונים בהתאמה לעידן הדיגיטלי.
יישום והטמעה
אנו דואגים להטמיע את פתרונות הלמידה, ההוראה וההערכה המתקדמים בבתי הספר ובמרחבי הלמידה.

מובילים למידה חדשנית
מטח במספרים
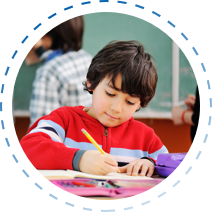
מורים
מקבלים ליווי ופיתוח מקצועי באמצעות מטח
בתי ספר
מלמדים עם חומרי לימוד מודפסים ודיגיטליים
תלמידים
משתתפים בלמידה חברתית וירטואלית
תלמידים
לומדים עם פלטפורמות דיגיטליות של מטח
נבחנים
בבחינות בגרות מתוקשבות
בתי ספר
מלמדים עברית בתפוצות
מרחבי הפעילות שלנו
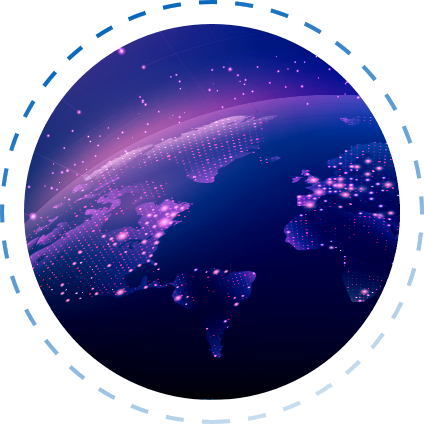
לומדים עם מטח ברחבי העולם
חיזוק הזיקה לישראל בקרב עשרות אלפי תלמידים בתפוצות הלומדים עברית באמצעות כלים ותכנים מתקדמים מבית מטח
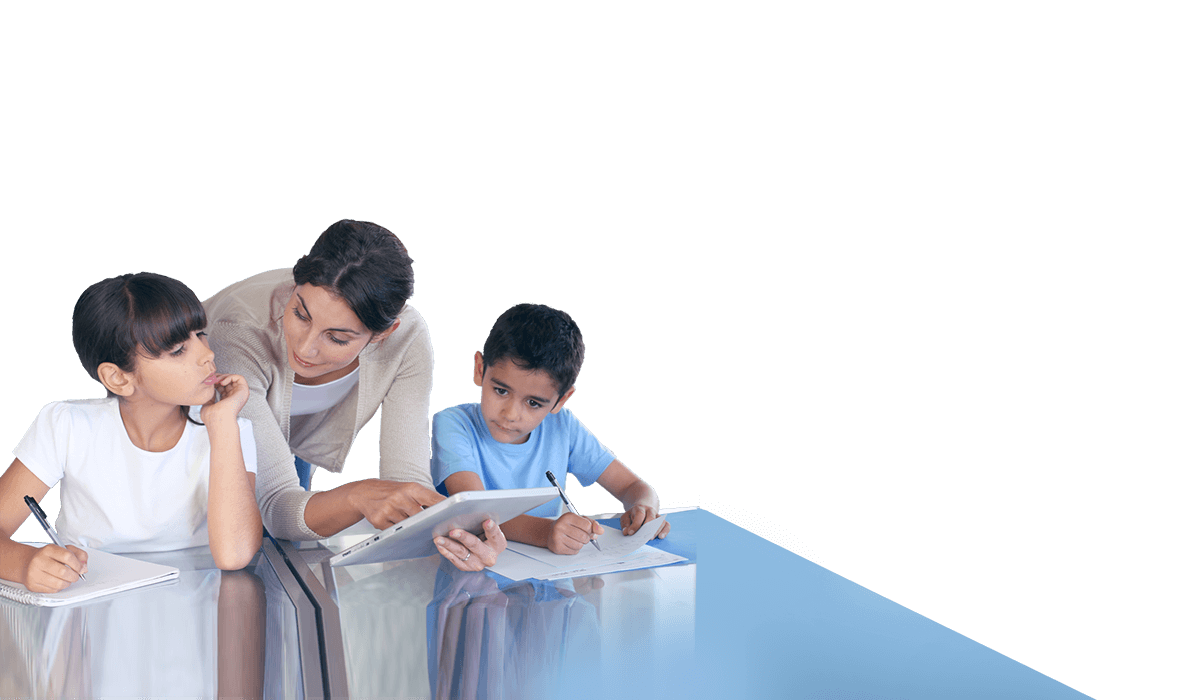
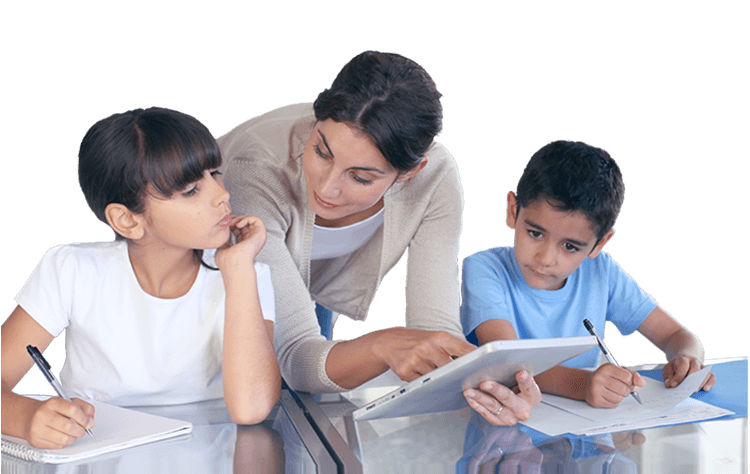
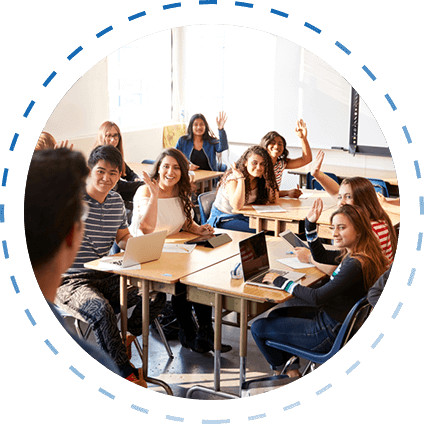
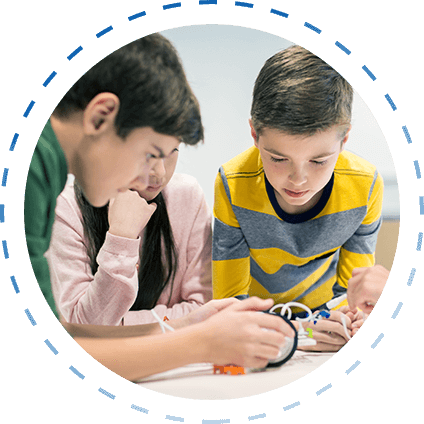
מובילים למידה חדשנית בבתי הספר
אנו מאמינים שלמידה היא יותר מהקניית ידע, ולכן מפתחים חוויית למידה עשירה ללומד ולמלמד המתמקדת בטיפוח כישורים ומיומנויות.
פתרונות למידה לרשויות ולעיריות
ההווה של ילדי העיר מעצב את העתיד שלה. מטח מציע פלטפורמות למידה חדשניות ומגוונות שיסללו את דרכם של תלמידי העיר לפיתוח מיומנויות המחר.
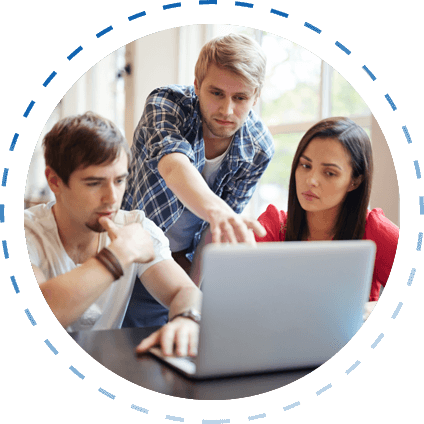
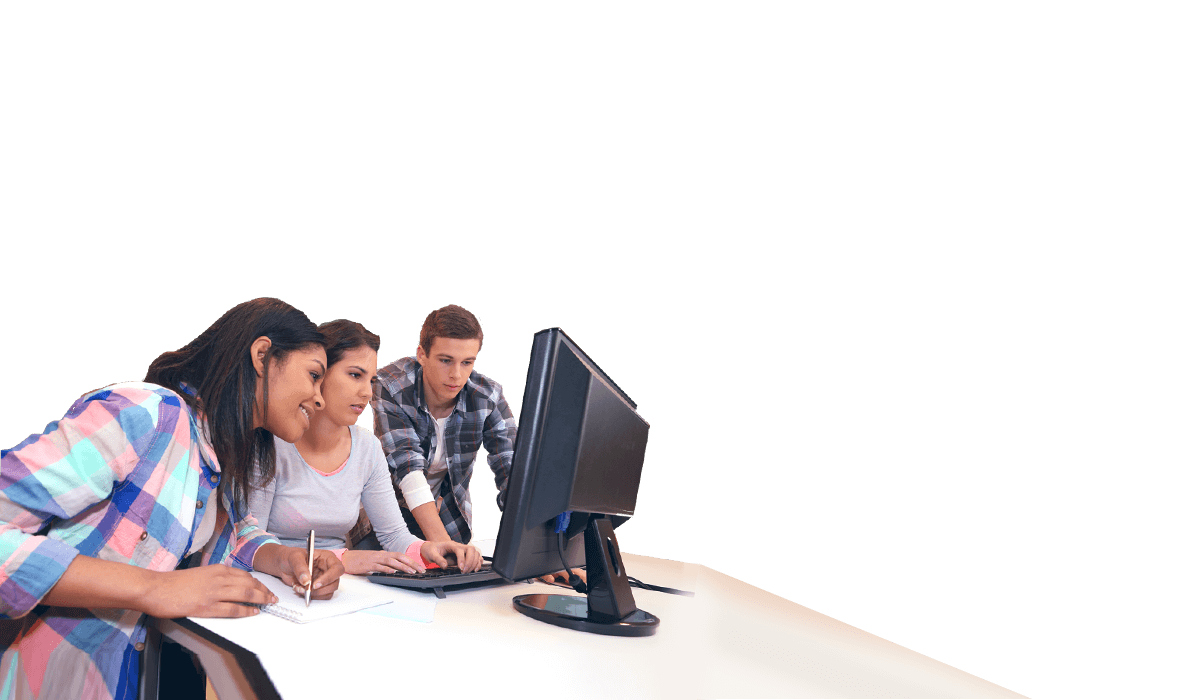
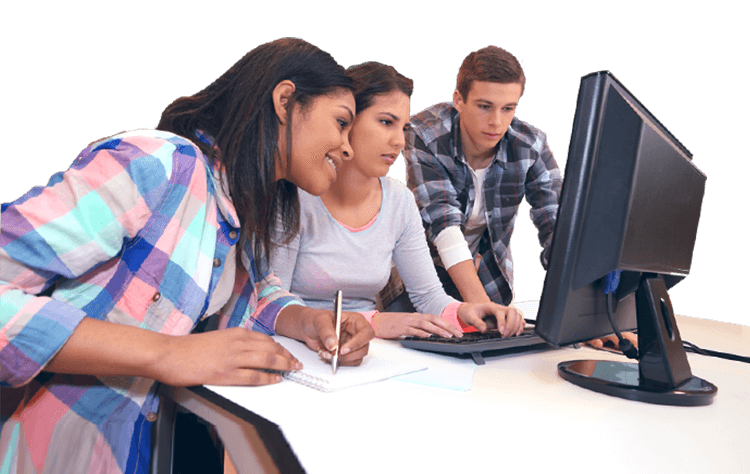
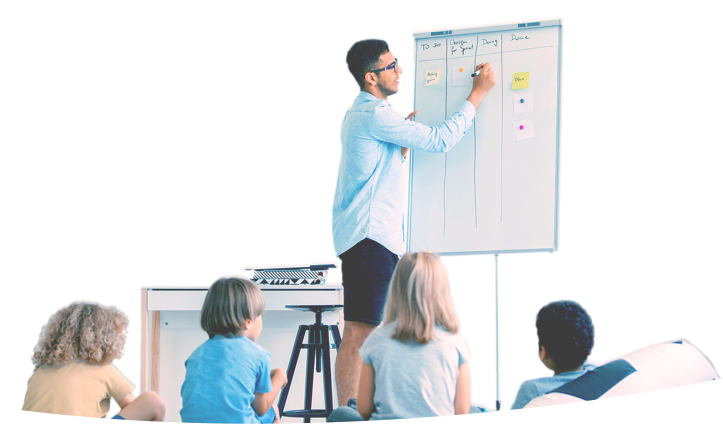
משקיעים בפיתוח סגלי ההוראה
עשרות אלפי מורים לומדים אונליין במאות ההשתלמויות המקצועיות של מטח בשיתוף משרד החינוך. הלומדים נהנים מאמצעי למידה חדשניים ומתקדמים.
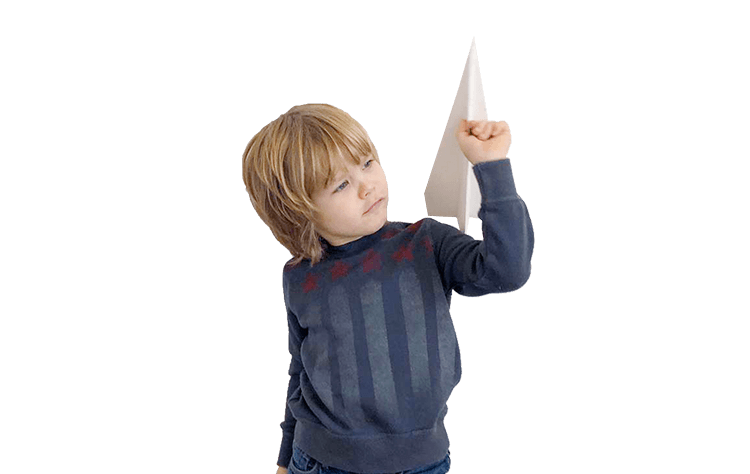
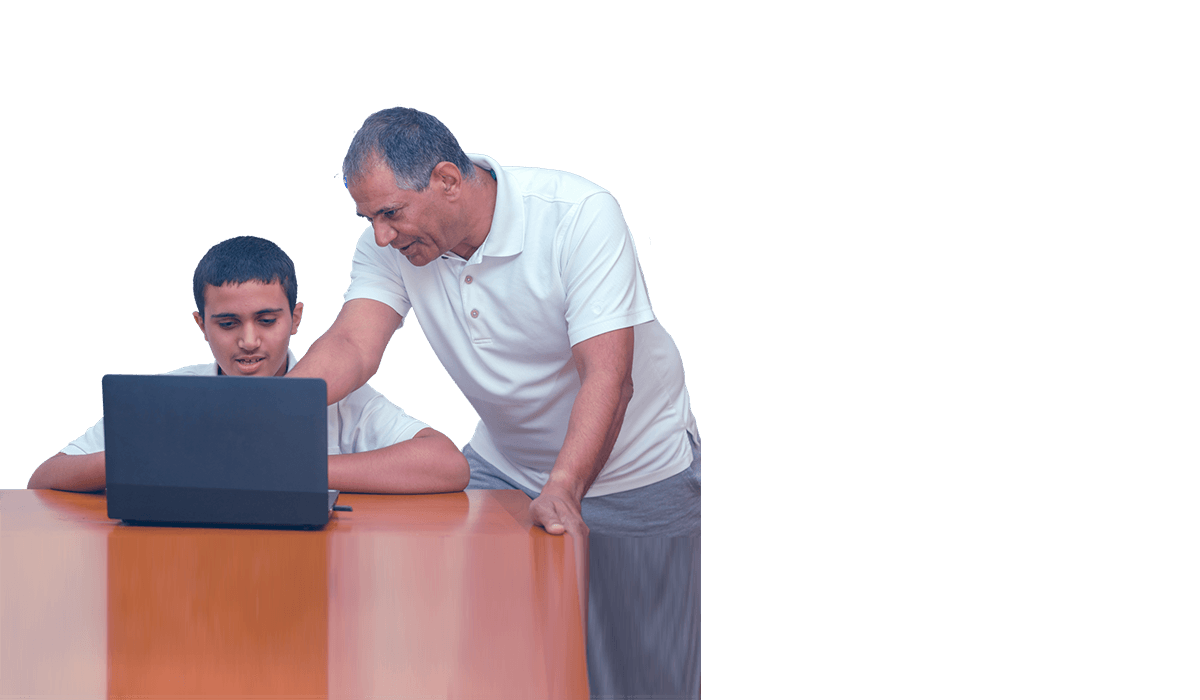
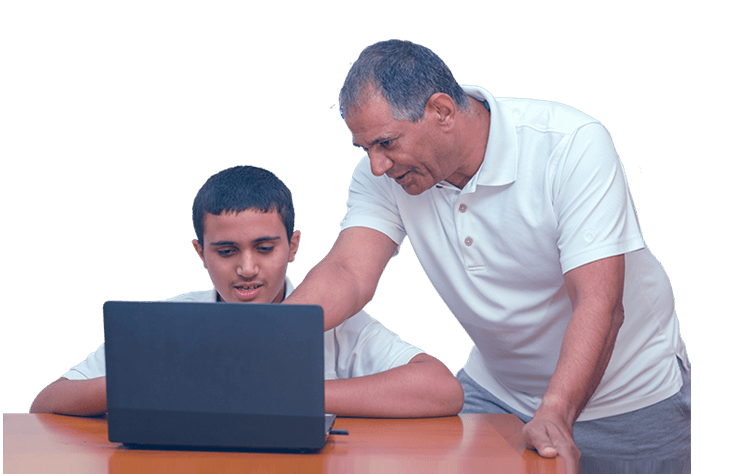
מאמינים בלמידה פרסונלית
לכל ילד וילדה יש את הדרך שלהם. אנו יוצרים עבור התלמידים מרחב למידה חדש – פיזי, דיגיטלי, אישי ואפקטיבי. הלמידה האדפטיבית מותאמת באופן אישי לצורך וליכולות של כל תלמיד ותלמידה.
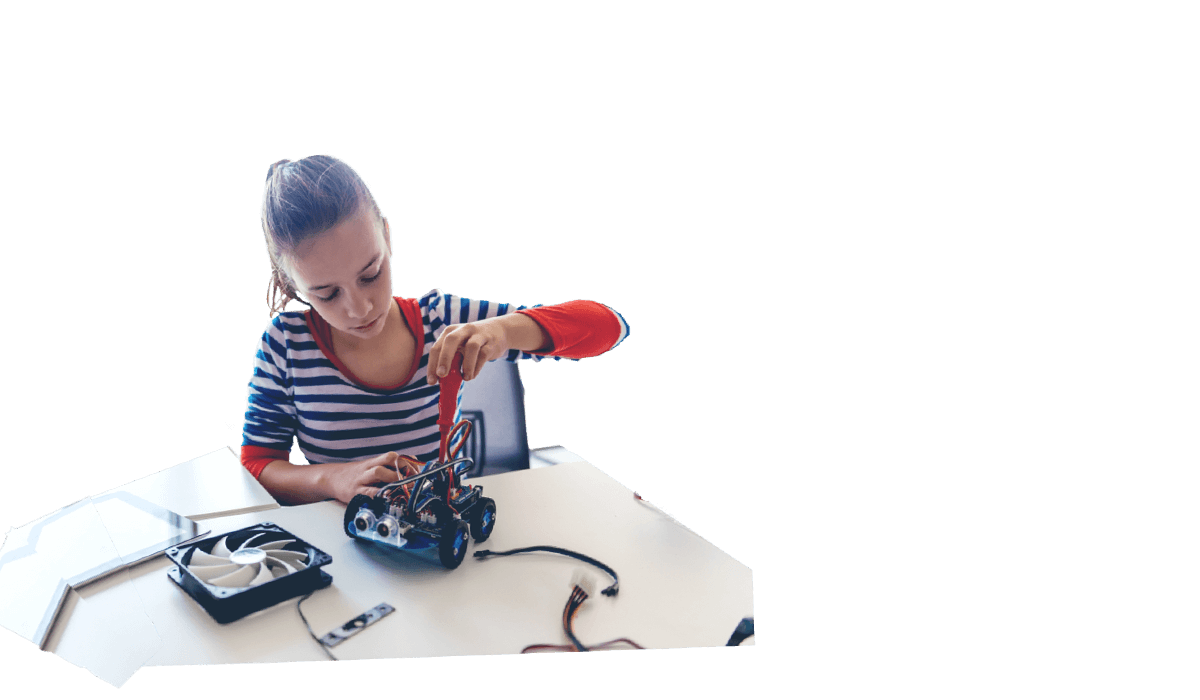
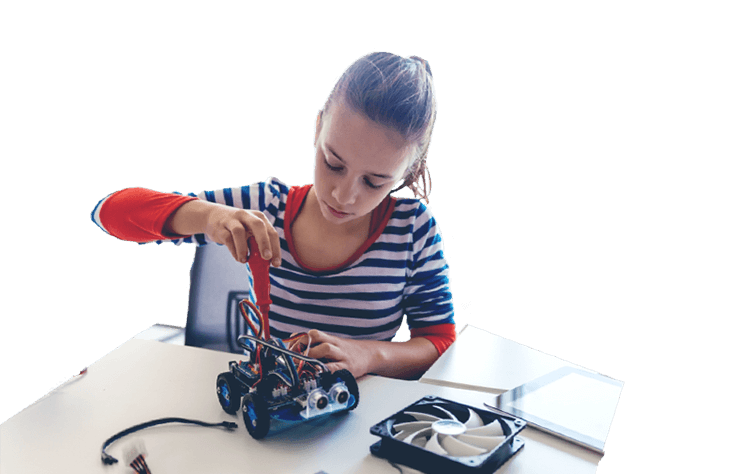
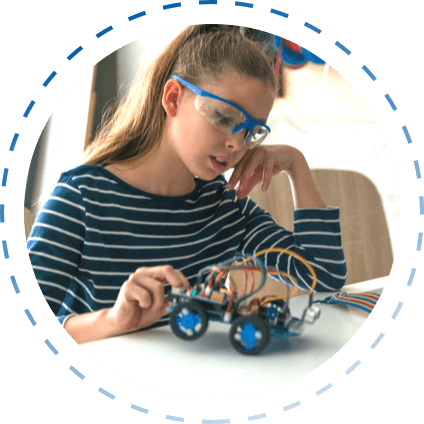
מובילים יזמות בחינוך
אנו מאמינים בכוחה של הטכנולוגיה לחולל שינוי. MindCET מבית מטח מטפחת ומאיצה יזמות טכנולוגית בעולם החינוך.
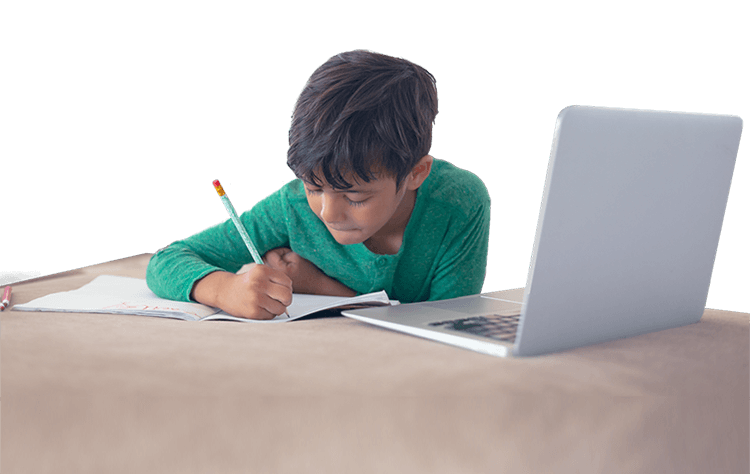
פועלים לצמצום הפערים בחינוך
אנו יוצרים פתרונות למידה המאפשרים לכל ילדי ישראל, על כל גווניה, ליהנות מחוויית למידה משמעותית.
לומדים עם מטח ברחבי העולם
חיזוק הזיקה לישראל בקרב עשרות אלפי תלמידים בתפוצות הלומדים עברית באמצעות כלים ותכנים מתקדמים מבית מטח
מובילים למידה חדשנית בבתי הספר
אנו מאמינים שלמידה היא יותר מהקניית ידע, ולכן מפתחים חוויית למידה עשירה ללומד ולמלמד המתמקדת בטיפוח כישורים ומיומנויות.
פתרונות למידה לרשויות ולעיריות
ההווה של ילדי העיר מעצב את העתיד שלה. מטח מציע פלטפורמות למידה חדשניות ומגוונות שיסללו את דרכם של תלמידי העיר לפיתוח מיומנויות המחר.
משקיעים בפיתוח סגלי ההוראה
עשרות אלפי מורים לומדים אונליין במאות ההשתלמויות המקצועיות של מטח בשיתוף משרד החינוך. הלומדים נהנים מאמצעי למידה חדשניים ומתקדמים.
מאמינים בלמידה פרסונלית
לכל ילד וילדה יש את הדרך שלהם. אנו יוצרים עבור התלמידים מרחב למידה חדש – פיזי, דיגיטלי, אישי ואפקטיבי. הלמידה האדפטיבית מותאמת באופן אישי לצורך וליכולות של כל תלמיד ותלמידה.
מובילים יזמות בחינוך
אנו מאמינים בכוחה של הטכנולוגיה לחולל שינוי. MindCET מבית מטח מטפחת ומאיצה יזמות טכנולוגית בעולם החינוך.
פועלים לצמצום הפערים בחינוך
אנו יוצרים פתרונות למידה המאפשרים לכל ילדי ישראל, על כל גווניה, ליהנות מחוויית למידה משמעותית.


השותפים שלנו